The Strait That Tilts the Balance
A 30-page research note on the structural transformation of oil market architecture triggered by the April 2026 Hormuz crisis. Full version available on request.

Assessed four months on: see The Hormuz Note, Four Months On, published 14 September 2026.
The 2026 Hormuz crisis has produced the largest single-month volume removal in oil market history — 10.1 mb/d in March per the IEA, roughly twice the volume of the 1973 Arab embargo for a comparable share of a market that has since roughly doubled. 1973 was a producer-consumer problem. 2026 is a transit problem.
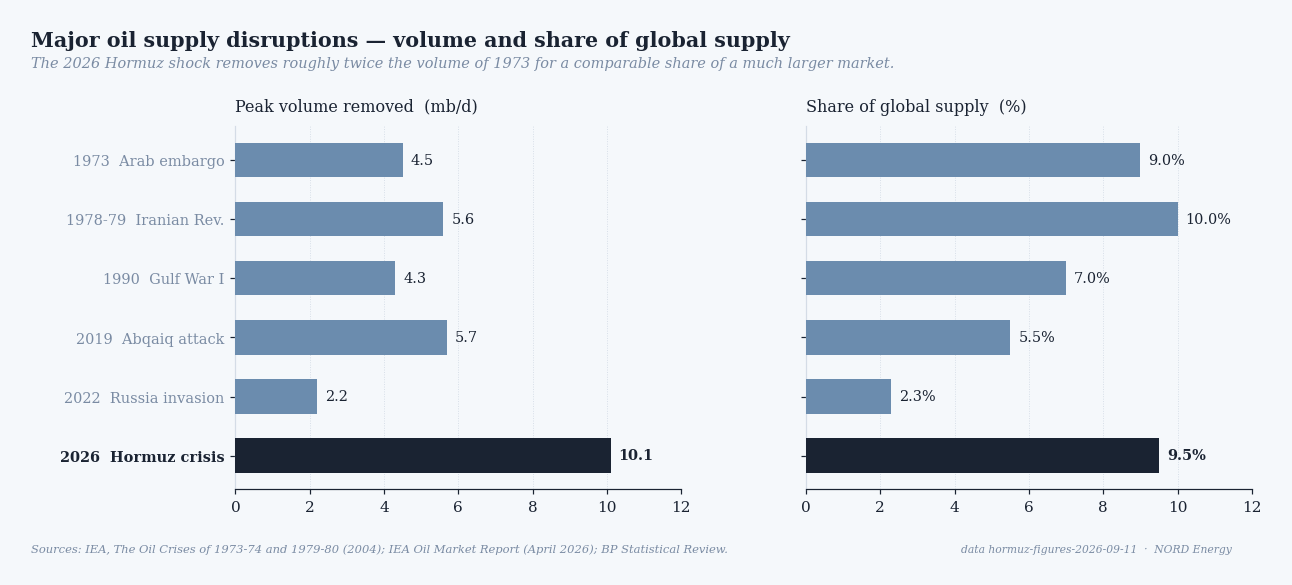
More importantly, it has exposed a structural feature of the international oil architecture that standard models underweight: spare production capacity and deliverable supply are not equivalent. When Saudi Arabia's 2.5 mb/d of spare capacity sits behind a closed Strait, its swing-producer lever is geographically neutralised.
Most analysis of the crisis has focused on prices. This note focuses on what the prices reveal about the architecture beneath them.
The Strait may reopen. The imbalances it has exposed will not close on their own.
Three arguments
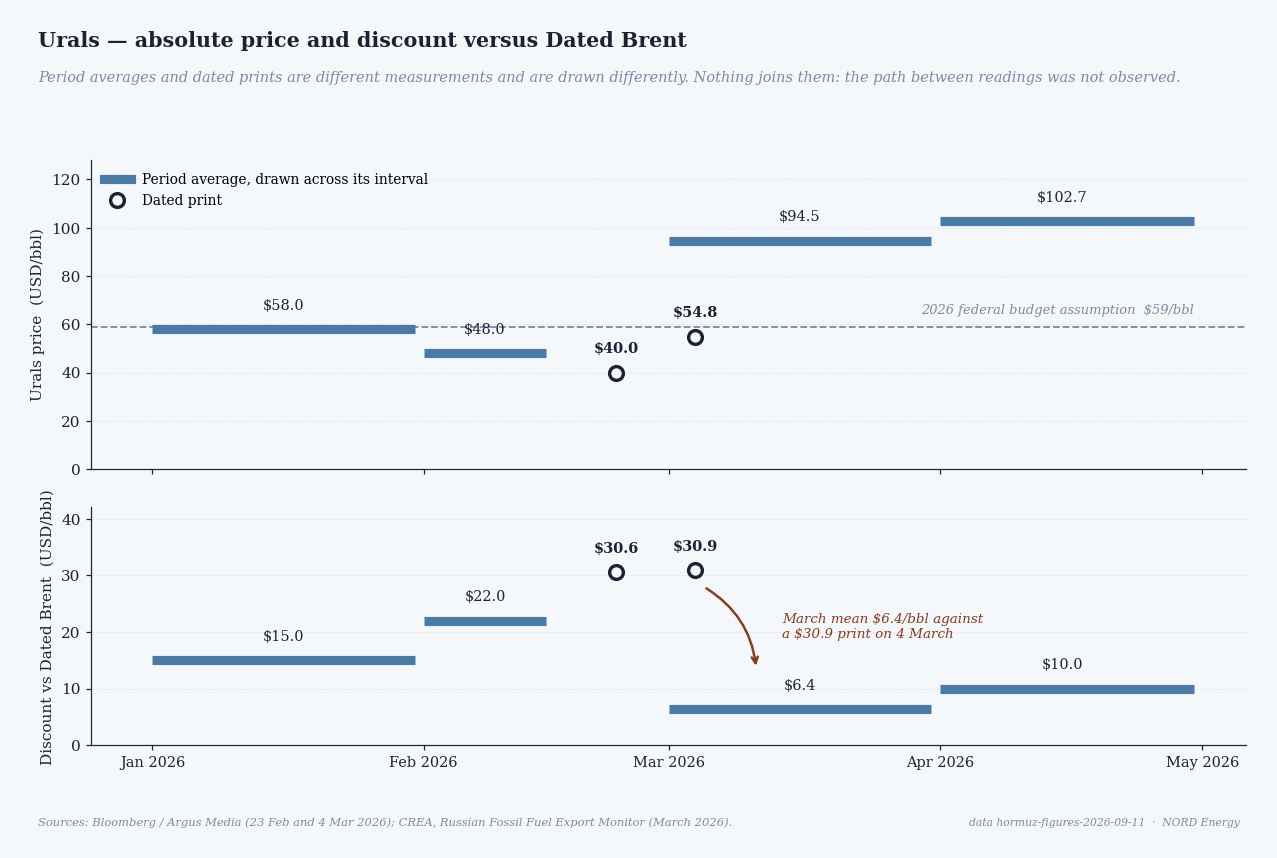
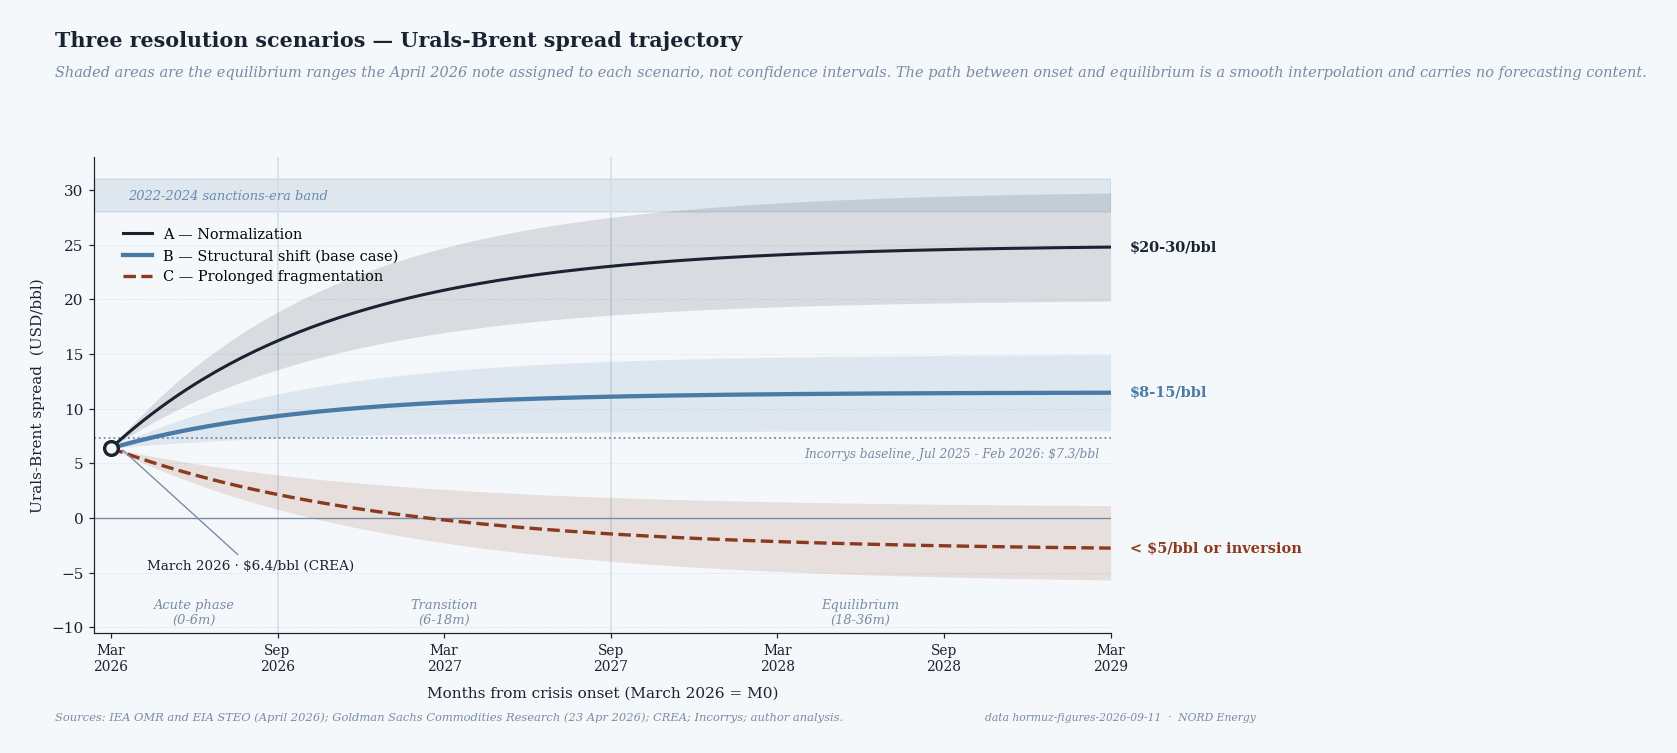
The Urals–Brent spread will not revert to its pre-crisis range. Asian refiners have reconfigured feedstock inputs and renegotiated term contracts during the crisis. Switching costs make a return to pre-crisis discount levels economically irrational at any spread below $15–20/bbl.
The yuan-denominated settlement architecture is now operational, not pilot. CIPS volumes rose 50% in March 2026; the IOC–ICICI Shanghai transaction crossed a precedent threshold. This infrastructure does not disappear with a ceasefire.
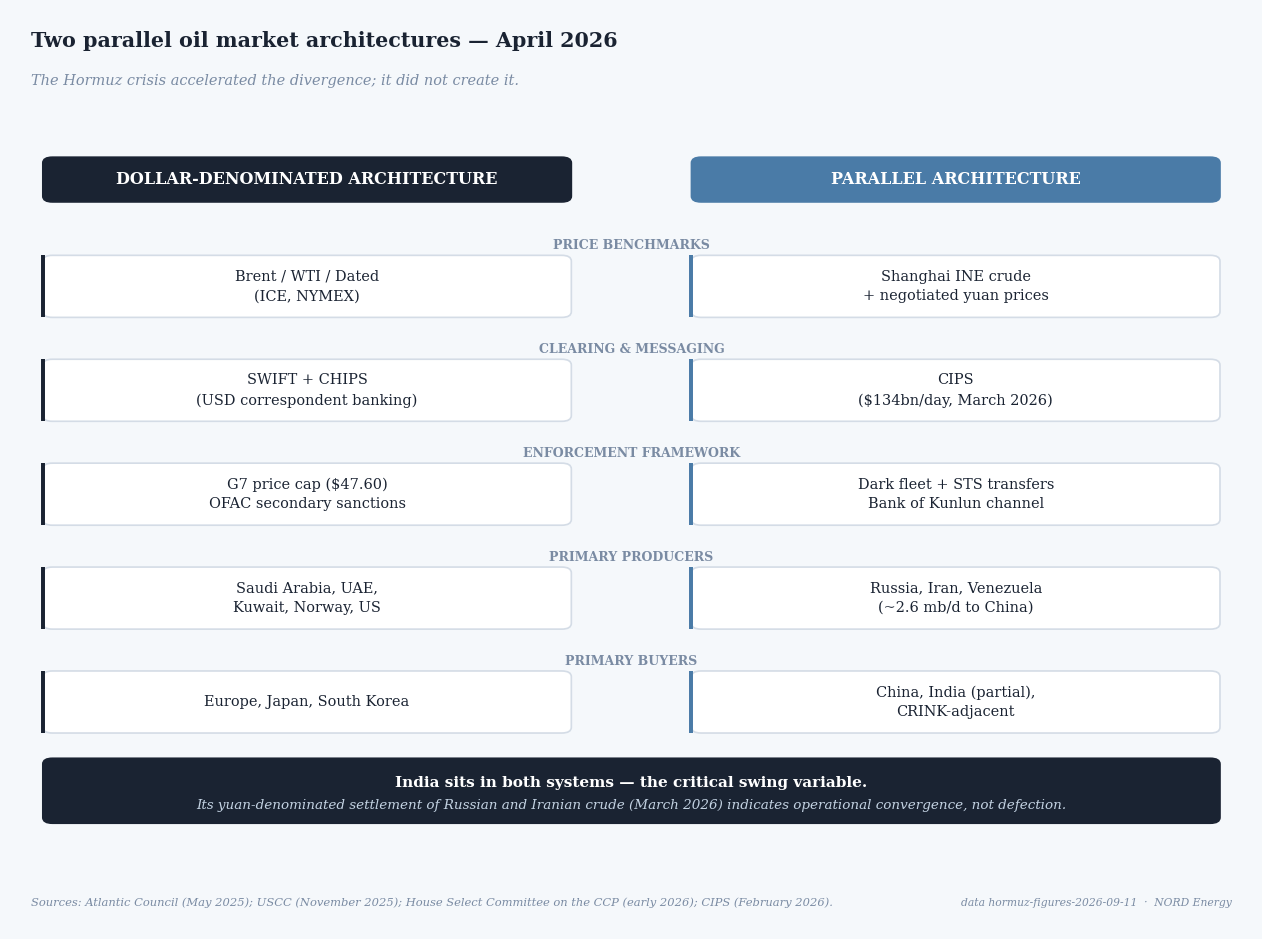
The April US blockade compounds the shift rather than reversing it. By compressing Iranian flows to China, it removes Russia's principal competitor for the Chinese sanctioned-barrel market and consolidates the rebalancing even in a Hormuz normalisation scenario.
Contents
- I. The largest supply shock in oil market history
- II. The spare capacity trap — power frozen by geography
- III. Russia's constrained windfall — price without volume
- IV. OPEC+ recomposition — quota compliance and parallel settlement
- V. Saudi Arabia's binding fiscal constraint
- VI. Turkey and the Ceyhan corridor
- VII. Three resolution scenarios and dashboard indicators
- Annex — Methodology, sources, and reconstructed estimates
Sources
IEA, EIA, CREA, RBC Capital Markets, Goldman Sachs, JP Morgan, CSIS, Middle East Insider, Argus Media, Vortexa, Kpler, PBOC, Atlantic Council GeoEconomics Center.
Access
Full note (30 pages, PDF) available on request: research@nordenergy.co
Published April 28, 2026.